Test case – we have an application to capture the details from credit card statements and then prepare Monthly Budget and compare Actual Amount Vs Allocated Account for each Spending category, plus display Bar Chart for Allocated amount Vs Actual Amount for each Category.
In this blog I will explain how to design Master Detail Page , plus how to add graph Component.
Components for this example
Database table
budget_header
budget_lines.
budget_categories
Steps
1.Open Oracle Jdeveloper (Jdev11g).
2.Select New application.
3.Select the template Fusion Web Application (ADF) and Wizard will help you to create TWO projects.
A. Model
B. View Controller.
Model is for Data Control and ViewController for UI.
In Model Project1. Design the Business Services by selecting categories > business tier >ADF Business components >“Business Components from table” and Wizard will help you to create Business Components..
2. Complete Database connection Setup.
3. Select the budget_header, budget_lines and budget_categories table and create Entity Object (EO), Updatable view (VO) and Application Module (AM) .4. Define view links between these 3 Vos.
5. Creation of Application Model will exposed all the Vos to client, and they will appear under Data Control.
6. Save your Work.
In ViewController Project open adfc-config.xml and drag a JSF page component by dragging View from Component palette. Save your work
1. Open the page and save it as budget.jspx. (Please note that this is unbounded task flow).
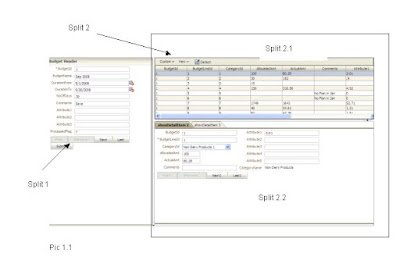
2. From Component palette Drag Panel Splitter in page as shown in pic1.1 and add the Panel Accordion, Panel collection and panel tabbed to newly created Spitted panel.
3. Now Drag the Budget header, lines from data control to JSF Page and our page is ready, as shown below.
In Pic 1.1
Split area “Split1” shows Budget Headre
Split area “Split2.1” shows budget lines Detail in table (Read – Only).
Split area “Split2.2” shows budget lines Detail in Form.
Pic 1.2 shows the Graph for Actual Spending Amount Vs Allocated Amount for a category.
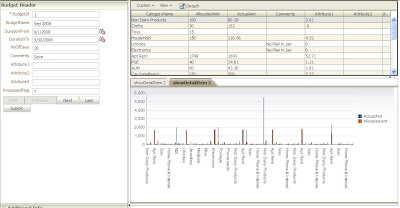
Pic 1.2
Both Pic 1.1 &1.2 shows the Master detail relationship between Budget Header/Lines.

Pic 1.3
As shown above Pic 1.3, ADF Control offer you built in function to select the column you want to Show or Hide, no coding has required for it.
As shown below Pic 1.4 , you can move the columns at run time without writing any code. In this example I have moved /draged Category Name column from last to First position.
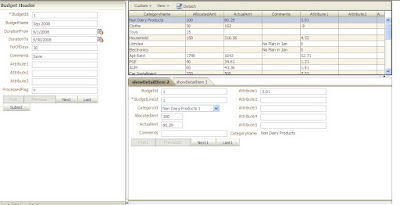
Pic 1.4
ADF Provide another built in feature “Detach” as shown below in Pic 1.5, that will detach one particular Page Section (in my case detail table section ) and display it over the Main Page. It will be very helpful if there is large amount of data in Detail and you want to see it all.
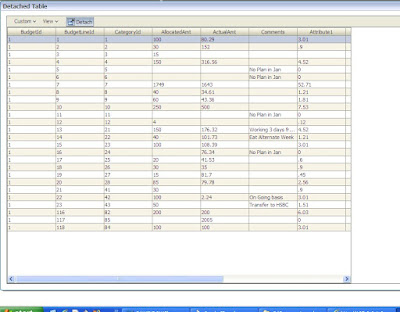
Pic 1.5
As shown below in Pic 1.6, I am calling the Custom Menu Function to export table data to excel sheet. (Please refer my previous blog about how to do that)
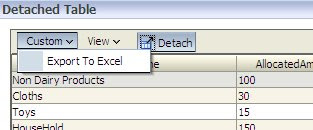
Pic 1.6
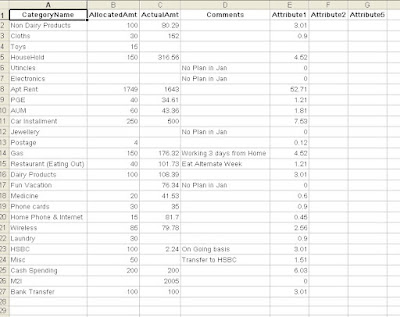
Pic 1.7
No comments:
Post a Comment